

Arc De Triomphe
Parabolas
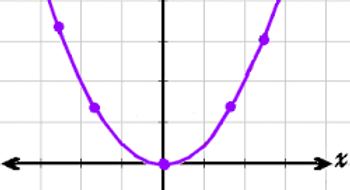
Quadratic equations, when graphed, create parabolas. To graph a parabola, you plot the points(preferrably the zeroes and the vertex), and then connect them with a curved line. The values of a quadratic equation affect the shape of the graph. The a value changes the width; the close "a" is to zero, the wider it will be. This is called compression, and the greater "a" is, the more stretched it will be. If it's negative, the parabola makes an inverted "u" shape. The "h" value is the horizontal shift. It determines the position of the vertex on the x-axis. The inverse of "h" is the amount of units the vertex is shifted over. The "c" value on a parabola is the vertical shift. Whatever "c" is, that's how many units the parabola moves up or down.The vertex is the maximum or minimum value of the parabola, depending on whether it's pointing up or down. The vertex is where the the other side of the parabola starts to form. Once you got the vertex, imaging a line going up and down from the vertex. Then, reflect the you already have graphed over this line. Parabolas normally have a u-shape, except there is a negative a value. The a value affects the width of the parabola, the inverse of h is the horizontal shift, and c is equal to the vertical shift. To derive an equation from a parabola, look at the graph and see if there are differences between it and the graph of the parent function, f(x)=x^2. The changes are then input into the new equation. For example, if the graph had it's points shifted up 5 from the graph of f(x)=x^2, then the new equation would be f(x)=x^2 + 5.